
Vessel · Sea
Ford-class Aircraft Carrier
Aircraft carrier class covered by FY2026 NDAA contract authority for no more than two carriers; no hull, builder, or award quantity is inferred.
- Milestones0
- Operators—
- Components—
- Programs—
- Capabilities—
- Inputs—
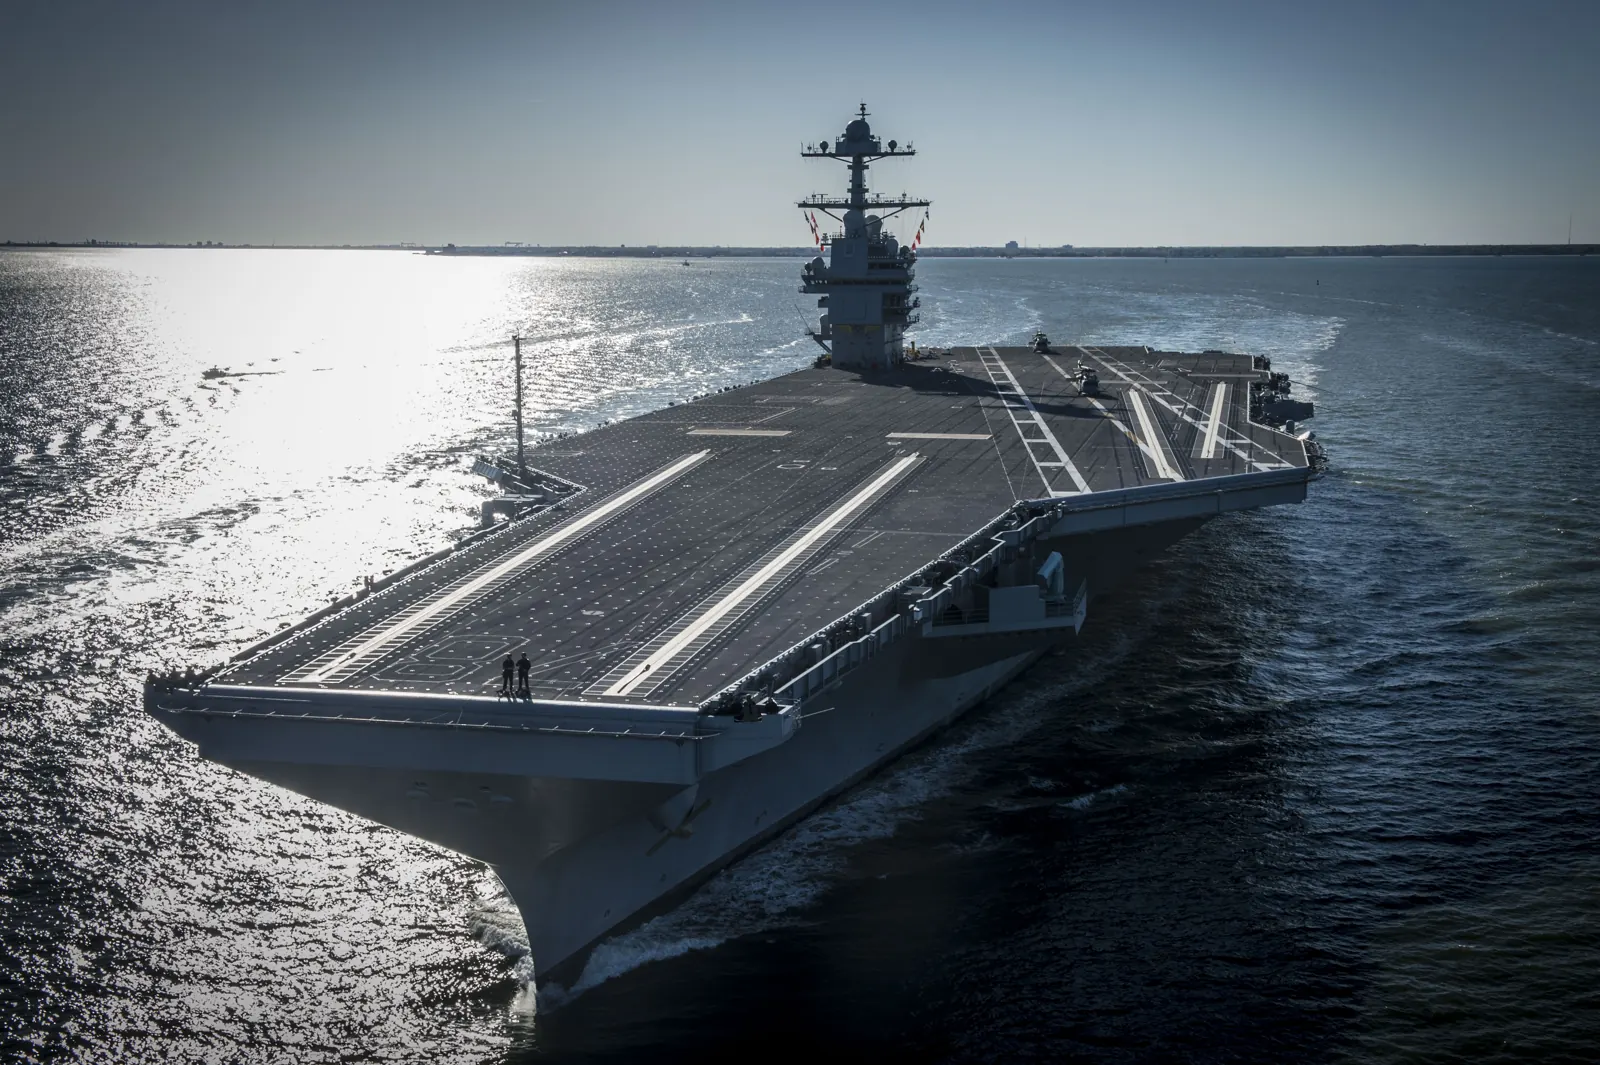
Photo: U.S. Navy photo by Mass Communication Specialist 2nd Class Ridge Leoni · Public domain (PD-USGov) · USS Gerald R. Ford (CVN-78) underway during builder’s sea trials in April 2017. Resized and reencoded as WebP; no additional crop.
Aircraft carrier class covered by FY2026 NDAA contract authority for no more than two carriers; no hull, builder, or award quantity is inferred.
Timeline
No milestones recorded for Ford-class Aircraft Carrier yet. The timeline fills in as unveilings, tests, contracts and deliveries are sourced.
Cost to the Government
Ships · HII Newport News Shipbuilding
Ford-class aircraft carriers
Hull-specific prices matter: the lead ship and later carriers have different schedules and procurement estimates.
CVN-81 procurement estimate
$15.211B
FY2026 budget · Then-year USD
Doris Miller; not yet delivered in this source. CVN-78 final procurement: $13.3165B; CVN-79: $13.196B; CVN-80: $14.2475B.
CRS ↗Commissioned Ford-class ship
1
FY2026 budget snapshot · U.S. only
CVN-78 commissioned; CVN-79 delivery scheduled for March 2027 in this source. Excludes Nimitz-class carriers.
CRS ↗Named ships in class plan
6
FY2026 budget snapshot · U.S. only
CVN-78 through CVN-83; planning is not an award or delivery.
CRS ↗Ship-program RDT&E
$4.885B
Dec. 2023 SAR / PB2025 · Then-year USD
CVN 78 ship subprogram estimate. Separately reported EMALS development is $1.0797B; avoid treating the ship subtotal as all carrier-related research.
Department of Defense ↗Cost & funding breakdown
CVN-78 · Gerald R. Ford
$13.317B
FY2026 budget / Dec. 2025 CRS · Then-year USD
Procured FY2008; commissioned July 2017; initial operational capability December 2021.
CRS ↗CVN-79 · John F. Kennedy
$13.196B
FY2026 budget / Dec. 2025 CRS · Then-year USD
FY2026 budget delivery forecast: March 2027. This is a forecast, not a delivery confirmation.
CRS ↗CVN-80 · Enterprise
$14.248B
FY2026 budget / Dec. 2025 CRS · Then-year USD
FY2026 budget delivery forecast: July 2030; part of the CVN-80/81 block buy.
CRS ↗CVN-81 · Doris Miller
$15.211B
FY2026 budget / Dec. 2025 CRS · Then-year USD
FY2026 budget delivery forecast: February 2032; part of the CVN-80/81 block buy.
CRS ↗CVN-82 · William J. Clinton
Not verified
Total procurement estimate not published in this report. FY2026 request includes $612M advance procurement, which is not a ship price.
CRS ↗CVN-83 · George W. Bush
Not verified
Total procurement estimate not published in this report. Future planned ship, not part of the commissioned fleet.
CRS ↗CVN-78 procurement in 2024 dollars
$19.6B
CBO 2025 analysis · Constant FY2024 USD
CBO restates the approximately $13.3B nominal ship procurement cost using naval shipbuilding inflation. Excludes class-wide R&D; not a second charge.
CBO ↗What the unit price includes
The comparison figure uses CVN-81, the highest published procurement estimate among CVN-78 through CVN-81 in this budget. It is not a class average. Ship procurement, class development and embarked aircraft are separate scopes. A carrier’s ship cost is not the cost of its air wing or an entire carrier strike group.
Why the estimates grew
CRS documents lead-ship cost growth and follow-on construction delays. The oversight record identifies new-system integration, weapons-elevator work, material availability and shipyard workforce constraints. Compare the same hull across budget years; cost-to-complete requests fund revisions to an existing ship estimate and should not automatically be added a second time.
Inflation and development change the comparison
CBO converts the lead ship’s approximately $13.3B nominal procurement cost into $19.6B in 2024 dollars using naval shipbuilding inflation. CBO says this excludes about $6B of class-wide R&D. The detailed SAR distinguishes ship-program RDT&E from the separately reported EMALS subprogram; these scopes should remain visible.
Operating estimates versus realized savings
The SAR’s annual $299.8M Ford estimate and $355.2M Nimitz comparator use constant FY2000 dollars. They are planning estimates, not current annual outlays. Reduced crewing and lifecycle savings are design objectives; verify them against actual sustainment evidence before describing them as realized savings.
Who buys and who builds
The U.S. Navy buys the carriers from Huntington Ingalls Industries’ Newport News Shipbuilding. The CVN-80/81 two-ship award covers a defined construction scope, not all government procurement costs. Budget requests, procurement estimates, contract awards and obligated spending answer different questions.
Operations & sustainment
Annual O&S per ship
$299.8M / yr
May 2023 estimate / Dec. 2023 SAR · Constant FY2000 USD
Program-office estimate covering manpower, operations, maintenance, support and improvements. Four ships, 50-year service lives, 2017–2082; not a current nominal annual bill.
Department of Defense ↗Four-ship lifetime O&S
$214.325B
Dec. 2023 SAR · Then-year USD
Four ships over 50-year service lives. Disposal is separately estimated at $37.2296B.
Department of Defense ↗Cost over time · 18 observations
Each row retains its original scope and dollar basis. Changing quantities, service life and inflation can change the estimate without changing the price of building one unit.
| Observation | Measure | Amount | Dollar basis | Evidence |
|---|---|---|---|---|
| FY2008 budget | CVN-78 procurement estimate Same-hull budget estimate; amounts include changes in scope and inflation. See CRS Table 2. | $10.489B | Then-year USD | CRS ↗ |
| FY2008 budget | CVN-79 procurement estimate Same-hull budget estimate; amounts include changes in scope and inflation. See CRS Table 2. | $9.192B | Then-year USD | CRS ↗ |
| FY2008 budget | CVN-80 procurement estimate Same-hull budget estimate; amounts include changes in scope and inflation. See CRS Table 2. | $10.717B | Then-year USD | CRS ↗ |
| FY2013 budget | CVN-78 procurement estimate Same-hull budget estimate; amounts include changes in scope and inflation. See CRS Table 2. | $12.323B | Then-year USD | CRS ↗ |
| FY2013 budget | CVN-79 procurement estimate Same-hull budget estimate; amounts include changes in scope and inflation. See CRS Table 2. | $11.411B | Then-year USD | CRS ↗ |
| FY2013 budget | CVN-80 procurement estimate Same-hull budget estimate; amounts include changes in scope and inflation. See CRS Table 2. | $13.874B | Then-year USD | CRS ↗ |
| FY2018 budget | CVN-78 procurement estimate Same-hull budget estimate; amounts include changes in scope and inflation. See CRS Table 2. | $12.907B | Then-year USD | CRS ↗ |
| FY2018 budget | CVN-79 procurement estimate Same-hull budget estimate; amounts include changes in scope and inflation. See CRS Table 2. | $11.377B | Then-year USD | CRS ↗ |
| FY2018 budget | CVN-80 procurement estimate Same-hull budget estimate; amounts include changes in scope and inflation. See CRS Table 2. | $12.998B | Then-year USD | CRS ↗ |
| FY2025 budget | CVN-78 procurement estimate Same-hull budget estimate; amounts include changes in scope and inflation. See CRS Table 2. | $13.317B | Then-year USD | CRS ↗ |
| FY2025 budget | CVN-79 procurement estimate Same-hull budget estimate; amounts include changes in scope and inflation. See CRS Table 2. | $12.936B | Then-year USD | CRS ↗ |
| FY2025 budget | CVN-80 procurement estimate Same-hull budget estimate; amounts include changes in scope and inflation. See CRS Table 2. | $13.72B | Then-year USD | CRS ↗ |
| FY2025 budget | CVN-81 procurement estimate Same-hull budget estimate; amounts include changes in scope and inflation. See CRS Table 2. | $14.016B | Then-year USD | CRS ↗ |
| FY2026 budget | CVN-78 procurement estimate Same-hull budget estimate; amounts include changes in scope and inflation. See CRS Table 2. | $13.317B | Then-year USD | CRS ↗ |
| FY2026 budget | CVN-79 procurement estimate Same-hull budget estimate; amounts include changes in scope and inflation. See CRS Table 2. | $13.196B | Then-year USD | CRS ↗ |
| FY2026 budget | CVN-80 procurement estimate Same-hull budget estimate; amounts include changes in scope and inflation. See CRS Table 2. | $14.248B | Then-year USD | CRS ↗ |
| FY2026 budget | CVN-81 procurement estimate Same-hull budget estimate; amounts include changes in scope and inflation. See CRS Table 2. | $15.211B | Then-year USD | CRS ↗ |
| January 2025 CBO | CVN-78 inflation-adjusted procurement CBO rebasing with naval shipbuilding inflation; excludes class-wide R&D. Do not treat rebasing as additional spending. | $19.6B | Constant FY2024 USD | CBO ↗ |
Contracts & purchasing · 1 records
Award values, ceilings and purchase agreements have different meanings. These records are not added together as total spending.
2019-01-31 · Design and construction modification
U.S. Navy → HII Newport News Shipbuilding
$14.918B · 2 units in scope
CVN-80 and CVN-81, contract N00024-16-C-2116. Separate $263,096,868 R&D and $31,097,671 support modifications also announced. Total government procurement includes more than this shipbuilder award.
U.S. Department of Defense ↗
International buyers
No international purchase documented in this review.
Coverage & open research
- Operating costs retain the historical estimate and dollar basis; actual recent annual expenditure is not verified.
- No international purchase record is included.
Unit costs and contract unit prices for this system, and budget figures for the programs that buy it. Each figure states its dollar basis and links its source; contract values are under Programs & awards.